Note
Go to the end to download the full example code.
Phase-phase coupling using shifted copy with noise#
In this example, we showcase the ppc_shifted_copy_with_noise() function, which
generates a time series with a given level of coherence and phase lag to the
provided input. We show that the requested values of coherence and phase lags are
obtained only on average across multiple simulations but not for each individual
simulation, and the variance of the result is higher for low values of coherence.
To start, we load the necessary functions first:
import numpy as np
import matplotlib.pyplot as plt

from harmoni.extratools import compute_plv
from meegsim.coupling import ppc_shifted_copy_with_noise
from meegsim.waveform import narrowband_oscillation
Then, we define the parameters of the simulated time series (sampling frequency, duration) as well as a set of phase lags and coherence values to be tested:
sfreq = 250
duration = 120
fmin = 8
fmax = 12
seed = 1234

n_lags = 3
n_cohs = 11
n_simulations = 25

phase_lags = np.linspace(0, np.pi / 2, num=n_lags)
target_coherence = np.linspace(0, 1, num=n_cohs)
As the input waveform, we use a narrowband oscillation in the alpha (8-12 Hz) frequency range:
Here comes the main part: we iterate over all values of phase lag and coherence, simulating several time series for each combination and assessing the obtained coherence immediately after:
seeds = np.random.SeedSequence(seed).generate_state(n_simulations)
coh_sim = np.zeros((n_lags, n_cohs, n_simulations), dtype=np.complex128)
for i_lag, lag in enumerate(phase_lags):
    for i_coh, target_coh in enumerate(target_coherence):
        for i_sim, seed in enumerate(seeds):
            y = ppc_shifted_copy_with_noise(
                waveform=x,
                sfreq=sfreq,
                phase_lag=lag,
                coh=target_coh,
                fmin=fmin,
                fmax=fmax,
                band_limited=False,
                random_state=seed,
            )
            # x is leading y
            coh_sim[i_lag, i_coh, i_sim] = compute_plv(
                y, x, n=1, m=1, plv_type="complex", coh=True
            )[0, 0]
/home/docs/checkouts/readthedocs.org/user_builds/meegsim/envs/latest/lib/python3.12/site-packages/meegsim/coupling.py:269: RuntimeWarning: divide by zero encountered in divide
  return np.divide(coh**2, 1 - coh**2)
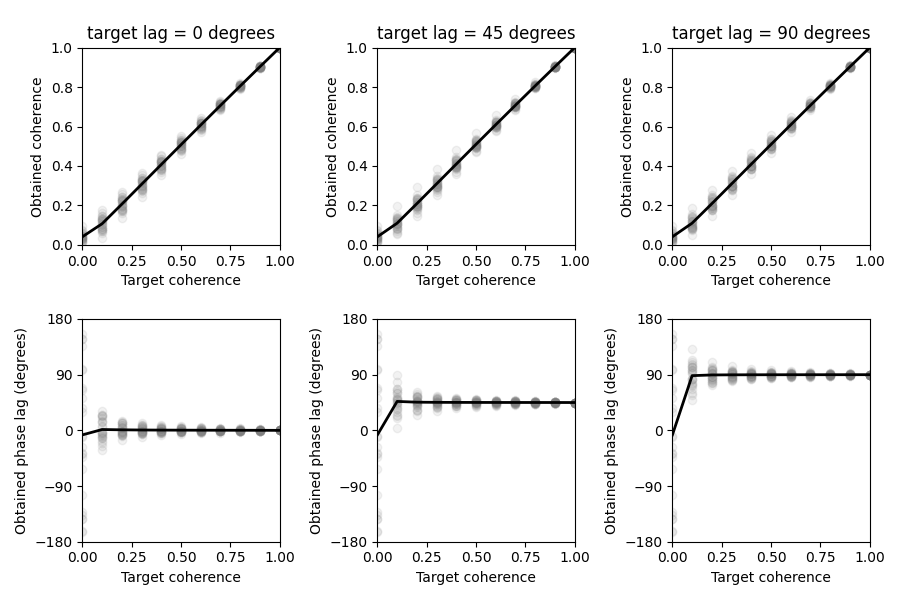
With all time series simulated, we can now assess the results by plotting the obtained coherence and phase lag values against the target ones. In the plot below, one can notice that for most values of target coherence, the mean obtained coherence and phase lag (illustrated with black solid lines) nicely correspond to the target parameters. However, we also see a bias for low values of coherence since it doesn’t reach zero even for time series of independent noise.
Similar observations can be made for the obtained phase lag: for high values of coherence, it can be obtained quite reliably, but the variance increases as the target coherence approaches zero.
target_coh = np.tile(target_coherence[:, np.newaxis], (1, n_simulations))
fig, axes = plt.subplots(nrows=2, ncols=n_lags, figsize=(9, 6))
for i_lag, lag in enumerate(phase_lags):
    lag_in_degrees = np.rad2deg(lag)
    obtained_coh = np.abs(coh_sim[i_lag, :, :])
    obtained_lag = np.rad2deg(np.angle(coh_sim[i_lag, :, :]))
    mean_coh = obtained_coh.mean(axis=1)
    mean_lag = obtained_lag.mean(axis=1)

    ax_coh = axes[0, i_lag]
    ax_coh.scatter(target_coh.flatten(), obtained_coh.flatten(), c="gray", alpha=0.1)
    ax_coh.plot(target_coherence, mean_coh, c="black", lw=2)
    ax_coh.set_xlim([0, 1])
    ax_coh.set_ylim([0, 1])
    ax_coh.set_aspect("equal")
    ax_coh.set_xlabel("Target coherence")
    ax_coh.set_ylabel("Obtained coherence")
    ax_coh.set_title(f"target lag = {lag_in_degrees:.0f} degrees")

    ax_lag = axes[1, i_lag]
    ax_lag.scatter(target_coh.flatten(), obtained_lag.flatten(), c="gray", alpha=0.1)
    ax_lag.plot(target_coherence, mean_lag, c="black", lw=2)
    ax_lag.set_xlim([0, 1])
    ax_lag.set_ylim([-180, 180])
    ax_lag.set_yticks([-180, -90, 0, 90, 180])
    ax_lag.set_xlabel("Target coherence")
    ax_lag.set_ylabel("Obtained phase lag (degrees)")
fig.tight_layout()
Total running time of the script: (0 minutes 5.969 seconds)